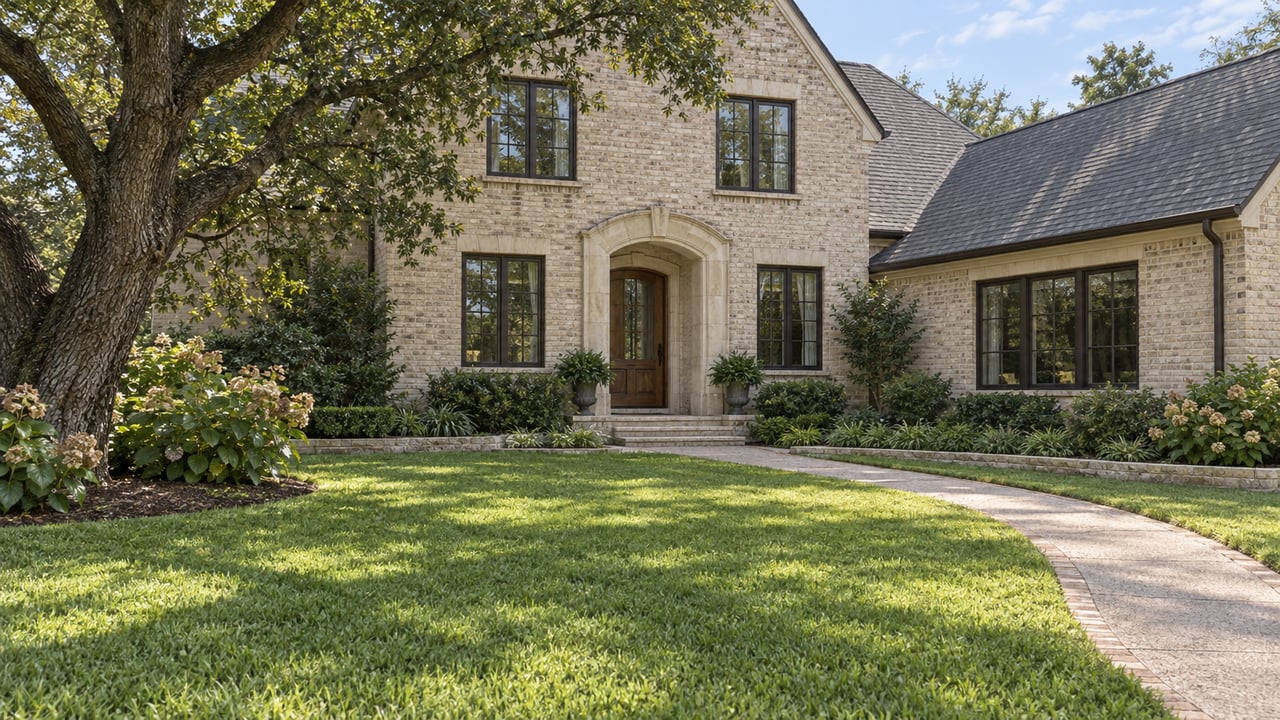
If you set your Sugar Land budget from the homes currently for sale in ZIP 77479, you are pricing yourself against homes that haven't sold yet. In September 2026, the median asking price across 397 active listings in that ZIP was $598,000, according to Houston Association of Realtors data. The most recent month of closed sales, August 2026, had a median of $510,000 across 63 transactions. The two figures cover different months and different groups of homes, so the $88,000 between them is not a discount any seller accepted. The gap comes from how a listings page fills up.
Homes that are priced well and show well tend to go under contract quickly and drop off the search results. Homes that are priced too high stay listed. Each week, the active pool loses some of its best-priced homes and keeps its slowest ones. Over time, the inventory you scroll through comes to describe the homes buyers are passing over.
About 400 homes for sale, and only 60 to 80 closings a month
Sugar Land's 77479 ZIP covers established communities like First Colony, New Territory, Greatwood, Telfair and Riverstone. Here is how the number of homes for sale compared with the number that closed over the past several months:
| Month (2026) | Active listings | Median asking price | Closed sales | Median sold price | Median sold days on market |
|---|---|---|---|---|---|
| April | 340 | $641,495 | 77 | $546,700 | 11 |
| May | 387 | $646,000 | 73 | $615,000 | 18 |
| June | 402 | $636,500 | 79 | $593,000 | 14 |
| July | 422 | $625,000 | 70 | $577,500 | 15.5 |
| August | 414 | $599,444 | 63 | $510,000 | 28 |
| September | 397 | $598,000 | not yet reported | not yet reported | not yet reported |
In August 2026, there were 414 homes listed and 63 closings. At that pace, the August inventory would take more than six months to sell. That is our own arithmetic, not a figure HAR publishes, but the point holds. In any given month, most of the homes you see listed will still be listed a month later. Those are the homes that set the asking median.
Over a full year, the asking median barely moves. Between October 2025 and September 2026, it stayed between $575,000 and $646,000. The sold median moved far more over roughly the same stretch, from $430,250 in February 2026 to $615,000 in May 2026. In 10 of the 12 months from September 2025 through August 2026, the same-month median asking price was higher than the median sold price.
Both medians matter, but they track different things. The asking median reflects what owners hope to get, and that changes slowly. The sold median reflects what buyers actually paid in a given month, and with only a few dozen sales, one month's mix of homes can move it a long way.
The backlog is resale homes, not builder inventory
In many western Houston suburbs, a gap between asking and sold prices could come from new construction. Builders list homes at full price and then offer incentives behind the scenes. That doesn't explain much of Sugar Land's gap.
Riverstone, one of the last big master-planned sources of new homes around Sugar Land, now describes itself as being in its "final chapter." Its homepage lists just one last section of homes available from its luxury custom builder, Psalms Fine Homes, and says half of those remaining homes sit on waterfront lots. In early October 2026, HAR's Sugar Land new-construction search showed only three active new-construction listings in 77479. HAR's ZIP page showed about 417 homes for sale at the same time. By our count, that puts new construction at under 1% of what's listed. HAR doesn't publish that share; it comes from the two snapshots.
So in this part of Sugar Land, resale homes are competing with other resale homes. A seller who prices against the asking prices of nearby active listings is lining up with the homes that have already been sitting. A buyer who treats those asking prices as the market is setting a budget around homes other buyers have already decided against.
The price band that slowed the most is Sugar Land's main band
This matters more in 2026 because of which price ranges have slowed across Houston. In August 2026, single-family sales across the Houston area fell 11.5% from a year earlier to 7,100 closings. The area had 38,947 active listings, which equals 5.3 months of inventory. The steepest drop was in the $500,000 to $999,999 band, where sales fell 16.5% to 1,221 transactions. Sales of homes at $1 million and above fell only 2.1%.
That $500,000 to $999,999 range is where most of 77479 sells. The ZIP's own numbers show the same slowdown. There were 63 closings in August 2026, compared with 78 in August 2025, while active listings rose slightly, from 406 to 414. Inventory held steady while sales fell, and more of the homes left on the market were the slow sellers.
Speed has changed too. The median 77479 home that closed in April 2026 had been on the market for 11 days. By August 2026, that number was 28 days. Across Houston, homes averaged 54 days on the market in August, compared with 52 a year earlier.
Inventory is growing unevenly across Sugar Land
A single citywide number hides the fact that the backlog is building at very different rates in different parts of Sugar Land. HAR splits the city into market areas, and the September 2026 reports for those areas show different conditions:
- Sugar Land South: listings up 1.9% year over year, 5.3 months of inventory, 39.9 average days on market, median sold price $708,080.
- Sugar Land North: listings up 32.7%, 5.9 months of inventory, 48.2 days on market, median sold price $439,459. HAR's summary notes that buyers there are negotiating below list price.
- Sugar Land East: listings up 42.7%, 4.2 months of inventory, 39.1 days on market, median sold price $477,477.
- Sugar Land West: listings up 18.9%, 6.0 months of inventory, 43.5 days on market, median sold price $508,388.
These market areas don't line up with ZIP code boundaries, so their medians aren't directly comparable to the 77479 figures above. Still, they show where the backlog is building. In the South market area, which has the highest prices, the number of listings has barely changed from a year ago. In the North and East areas, listings are up by a third or more. East still has the fewest months of supply of the four, so homes there are still selling even as more come on the market. In North, inventory growth and longer selling times are showing up together.
Next door in ZIP 77478, the backlog is smaller compared with sales. There were 107 active listings in August 2026 and 25 closings that month, and the median sold price of $465,000 was much closer to the August median asking price of $499,000. A smaller backlog means the gap between asking and sold prices is smaller too.
Using sold prices instead of asking prices
For a buyer comparing Sugar Land with Katy, Cypress or Fulshear, a better starting point than the asking median is a short set of questions about the specific streets you're considering:
- What did comparable homes in this section close for over the last 90 days, and how long were they on the market?
- How many similar homes are listed right now, and how many have been listed longer than the area's typical days on market?
- Is this listing part of a market area where inventory is flat or one where it's up by a third?
Sellers need the same information for the opposite reason. When 63 homes close in a month and around 400 are listed, the homes that are already sitting tell a seller what price to stay below. The comparable sales that matter are the ones that closed.
A few questions we hear often
Does an $88,000 gap mean Sugar Land sellers are cutting prices by that much? No. The September 2026 asking median and the August 2026 sold median describe different groups of homes in different months. HAR's ZIP data doesn't include a sale-to-list ratio for 77479, so the true negotiated discount on a given home has to come from comparable closed sales.
Why did the 77479 sold median drop from $615,000 in May to $510,000 in August 2026? Part of it is the slowdown in the $500,000 to $999,999 band across Houston. Part of it is sample size. With 60 to 80 closings a month, a few more higher-priced or lower-priced homes closing in a given month can move the median a lot. Looking at several months together gives a steadier picture than any single month.
Is new construction setting the price ceiling in Sugar Land? Not in 77479 right now. Riverstone is down to a final section of custom homes, and new construction made up under 1% of the ZIP's listings in an early October 2026 snapshot.
Is the September closed-sale data for 77479 available yet? Not as of early October 2026. HAR's ZIP tables show September asking-price data but end closed sales at August. The Texas Real Estate Research Center's public Fort Bend County table only runs through July 2026.
If you're weighing a home in 77479 against the rest of the market, The Hightower Team can pull the recent closed sales for the streets and sections you're considering and show you how long similar homes have been listed, so your offer or list price is based on what's actually selling. Contact Us when you're ready to look at those numbers together.